S&P500 Daily Action Areas & Price Targets 10/11/26

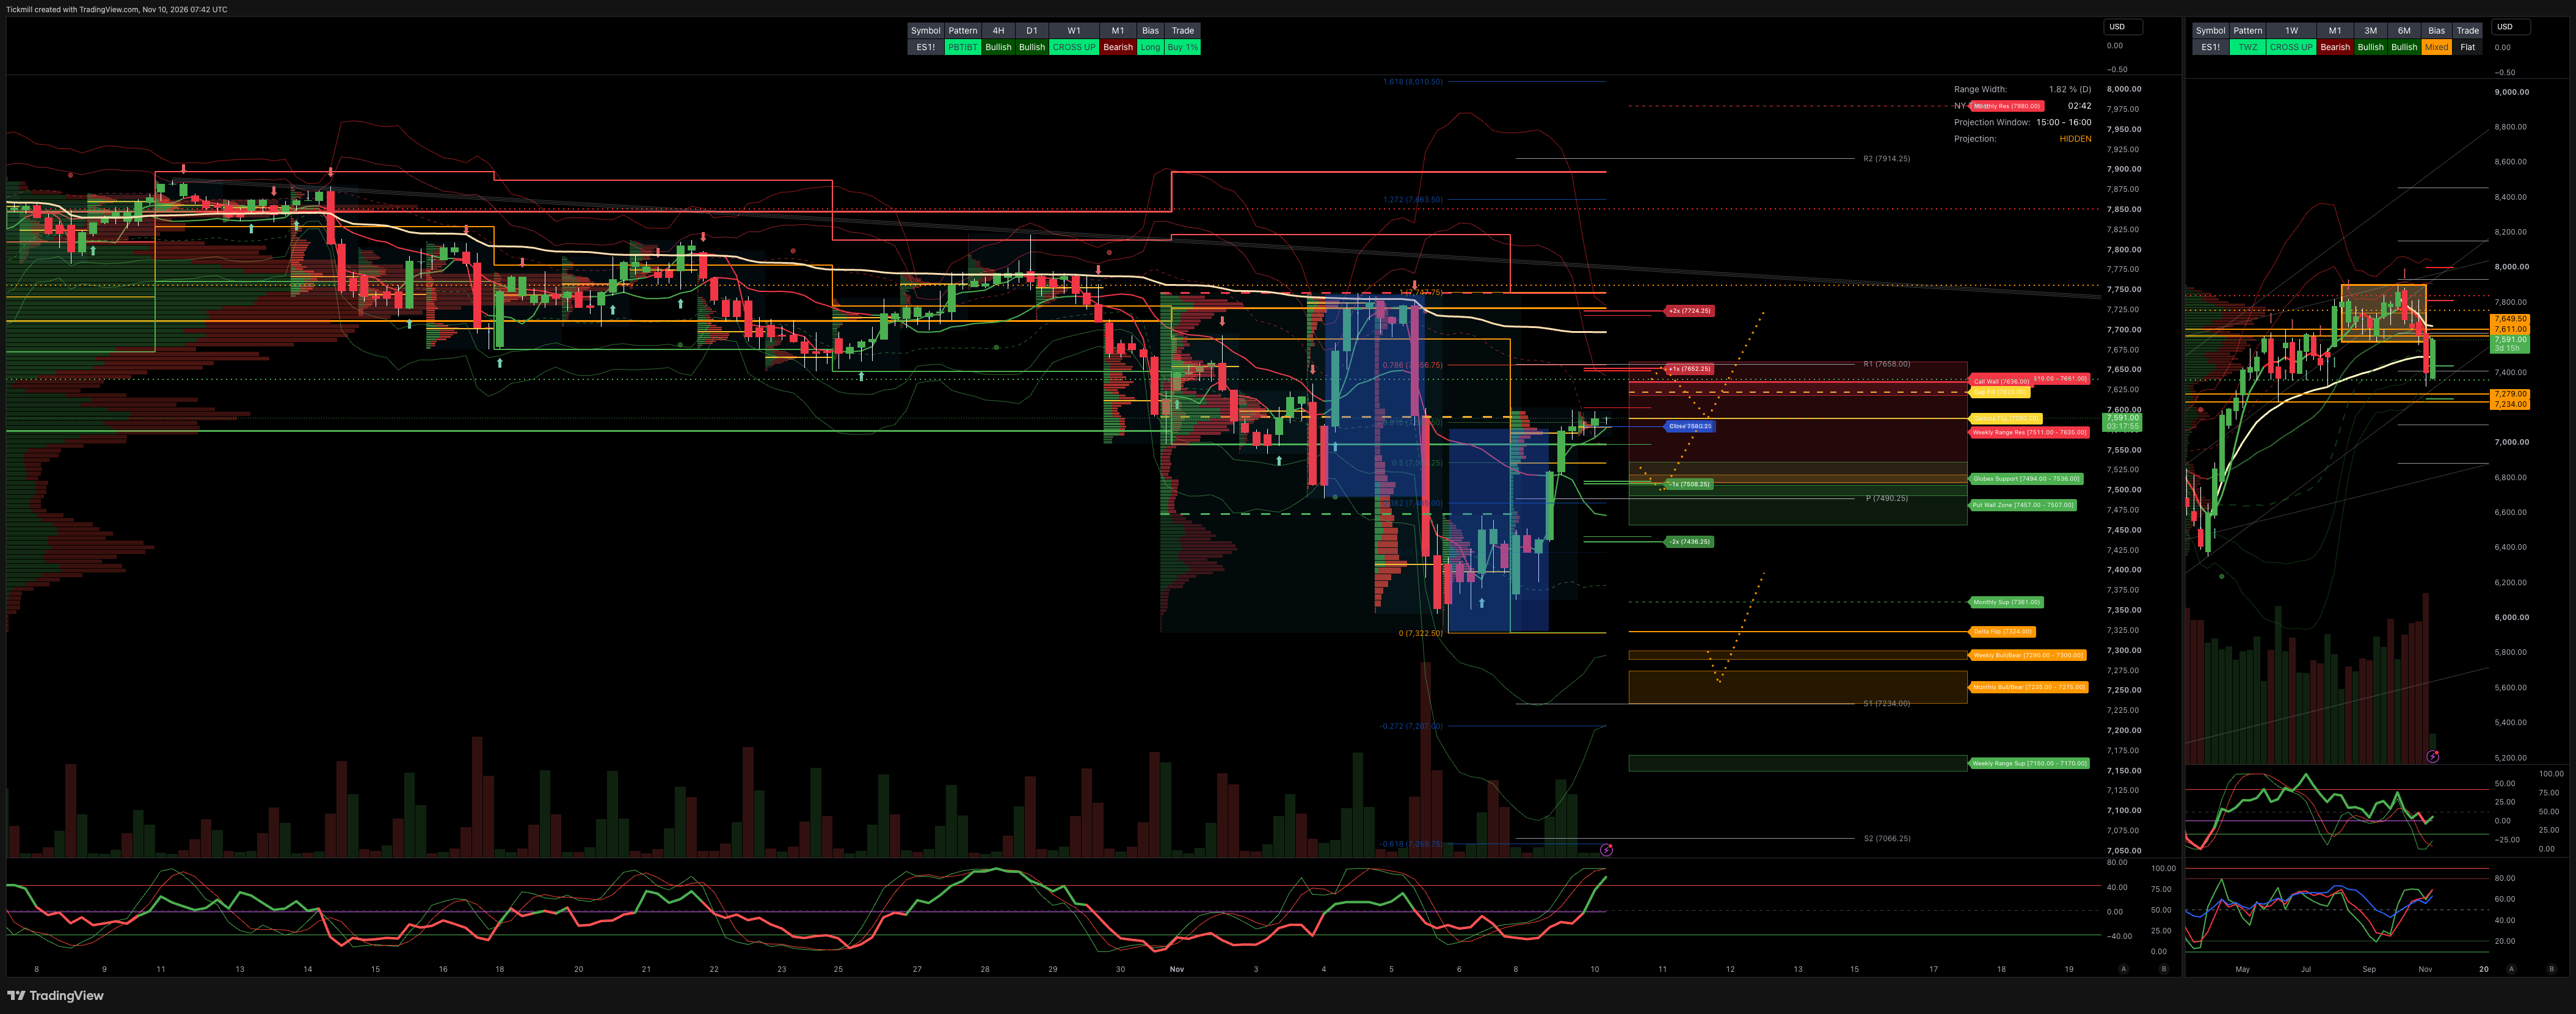
S&P500 Daily Action Areas & Price Targets 10/11/26
***QUOTING ES1!(Z CONTRACT LEVLES) FOR CASH US500 EQUIVALENT LEVELS, SUBTRACT POINT DIFFERENCE***
MONTHLY-WEEKLY& DAILY LEVELS
MONTHLY BULL BEAR ZONE 7275/35
MONTHLY RANGE RES 7980 SUP 7361
WEEKLY BULL BEAR ZONE 7300/7290
WEEKLY RANGE RES 763/511 SUP 7170/50
DAILY BULL BEAR ZONE 7520/30
GLOBEX RANGE SUP 7536/7494 RES 7619/61
GAMMA FLIP 7590
DELTA FLIP 7324
CALL WALLS 7636
PUT WALLS 7507/7457
DAILY STRUCTURE - TBC
WEEKLY STRUCTURE - OTFL - 7746
MONTHLY STRUCTURE - TBC
VIX BULL BEAR ZONE 18.72
VVIX-to-VIX ratio, currently hovering at approximately 4.94, comfortably falls within the historically typical range of 4.0 to 6.0. This suggests that volatility expectations are in a neutral zone, reflecting neither panic nor extreme contrarian sentiments.
PRIMARY TRADES & TARGETS
LONG ON REJECT/RECLAIM DBBZ TARGET RTH CLOSE>DAILY RANGE RES
***ADDITIONAL SETUPS & TARGETS HIGHLIGHTED ON THE CHARTS***
(I FADE TESTS OF 2 SIGMA LEVELS ESPECIALLY INTO THE FINAL HOUR OF THE NY CASH SESSION AS 90% OF THE TIME WHEN TESTED THE MARKET WILL CLOSE ABOVE OR BELOW THESE LEVELS)
SPX PUT/CALL RATIO 1.11 (The numbers reflect options traded during the current session.) A put-call ratio below 0.7 is generally considered bullish, and a put-call ratio above 1.0 is generally considered bearish.
JHEQX Upside cap (~7,920–7,950): Dealer gamma hedging at this call strike creates resistance, with market makers likely selling futures into strength and limiting volatility. Downside cushion (~7,270): If SPX drops 5% into Q4, long put gamma may force dealers to buy futures as the index falls, helping stabilize prices. Expiration: December 31, 2026. Strong pinning effects are likely near key strikes into year-end expiration.
DEC2025 OPEX to DEC2026 OPEX is 945 points giving us a range of [5889,7779]
Notes On Structure Implications
Balance: This refers to a market condition where prices move within a defined range, reflecting uncertainty as participants await further market-generated information. Our approach to balance includes favouring fade trades at the range extremes (highs/lows) while preparing for potential breakout scenarios if the balance shifts.
One-Time Framing Higher (OTFH): This represents a market trend where each successive bar forms a higher low, signalling a strong and consistent upward movement.
One-Time Framing Lower (OTFL): This describes a market trend where each successive bar forms a lower high, indicating a pronounced and steady downward movement.
GOLDMAN SACHS FICC & EQUITY TRADING DESK VIEWS
THE TAKE: BROAD BREADTH SURGE (423/500 UP) MEETS HISTORIC VVIX CRUSH AS POSITIONING COILS
US equities mounted an explosive across-the-board recovery on Monday, headlined by violent right-tail factor moves: Nasdaq-100 surged +3.40% to 27,907, the Philadelphia Semiconductor Index (SOX) ripped +6.8% (rallying aggressively despite Nvidia trading -4.3% on weekend headlines), Russell 2000 gained +3.18% to 2,841, and the S&P 500 advanced +2.35% to close at 7,549.
Breadth was exceptionally broad, with 423 out of 500 S&P constituents closing in the green. The catalyst mix centered on:
Middle East Geopolitical De-escalation: WTI Crude tumbled -4.23% to $87.03/bbl (Brent broke back toward $85/bbl) following President Trump's public remarks to CNN that direct military strikes on Iran are "highly unlikely" conditioned on Tehran entering a comprehensive agreement.
Historic Volatility Implosion: The VVIX (volatility of VIX) registered its 3rd largest single-day percentage decline in the past 20 years, triggering a rapid collapse in cross-asset implied volatility and option skew.
The Coiled Positioning Baseline: Goldman Sachs Prime Brokerage confirms that US Info Tech net allocation collapsed to 14.4% of total US net market value—plumbing multi-year lows at the 1st / 1st / 3rd percentiles across 1-year, 3-year, and 5-year lookbacks, respectively.
While High-Touch desk flow saw constructive covering and selective long accumulation across technology, trading floors remained cautious ahead of Tuesday's October CPI release (GS GIR forecasting +16 bps MoM Core CPI) and key upcoming AI earnings reports (CoreWeave CRWV, Nebius NBIS).
CROSS-ASSET BENCHMARK DASHBOARD
S&P 500 (SPX): Closed at 7,549.00 (+2.35%) | MOC $4.0B to SELL | VIX crushed -22.31% to 19.92 | 1-Week Implied Straddle: 1.50%
Nasdaq-100 (NDX): Closed at 27,907.00 (+3.40%) | Paced by semiconductor and cloud recovery
Philadelphia Semiconductor Index (SOX): Surged +6.80%, decisively decoupling from Nvidia (
NVDA-4.3%)Russell 2000 (RUT): Closed at 2,841.00 (+3.18%) | Small-cap cyclicals squeezed on easing yields and oil
Dow Jones (DJI): Closed at 52,389.00 (+2.15%) | Broad participation across industrial and consumer components
US 10-Year Treasury Yield: Ticked up +1 bp to 4.87% | Yields stabilized following the duration rally
WTI Crude: Plunged -4.23% to $87.03/bbl | Eased on geopolitical de-escalation statements
Gold: Rose +1.67% to $4,138.00/oz | Sustained institutional bid alongside weakening USD
Bitcoin: Up +1.00% to $74,807.00 | Stabilized following last week's tech flush
US Dollar Index (DXY): Slid -61 bps to 101.67 | Softened as oil and event risk premia compressed
PRIME BROKERAGE POSITIONING & GIR VALUE ASYMMETRY
Info Tech Multi-Year Allocation Floor:
US Info Tech Net Allocation: Has dropped to 14.4% of total net market value.
Historical Percentiles: Sits at the 1st percentile 1-year, 1st percentile 3-year, and 3rd percentile 5-year.
Semiconductor Positioning: Has fully round-tripped all 2026 gains, completely de-risking investor balance sheets.
GIR Flag: Tech is "Clearly Oversold":
AI Compute (Broadcom
AVGO, NvidiaNVDA): Valuations have compressed to levels that implicitly discount zero top-line growth past 2027.Semicap Equipment (Applied Materials
AMAT, Lam ResearchLRCX): Current share prices price in zero incremental wafer fab equipment / capex expansion beyond 2027, an outcome GIR views as highly improbable.Memory (SK Hynix, Samsung): Trading at an outright discount to total tangible book value, creating significant downside support.
SYSTEMATIC FLOW MECHANICS & BUYBACK DESK DYNAMICS
Medium-Term CTA Systematic Pivot: S&P futures settled at 7,549, crossing just above the crucial 7,548 medium-term systematic threshold. Holding above 7,548 is vital to halt programmatic model selling.
Closing Imbalance & CTA Selling Bias: S&P Market-on-Close (MOC) was $4.0B to SELL. Systematic CTA models remain projected net sellers of US equities across all scenarios over the coming week unless spot pushes materially higher.
Corporate Repurchase Open Window:
Current Window: ~90% of the S&P 500 is in an open execution window.
End-of-Week Window: Projected to hit ~93%.
Flow Impact: Open corporate buyback execution provides strong daily VWAP demand, matching favorable November seasonality (one of the desk's most active months of the year).
DERIVATIVES SURFACE: HISTORIC VVIX UNWIND & OPTIONS FLOWS
VVIX Implosion: The volatility of VIX printed its 3rd sharpest single-day collapse in 20 years, collapsing skew and crushing fixed-strike volatilities across SPX and NDX.
Institutional Put Spread Unwinds & Call Replacements:
Clients aggressively unwound front-month downside hedges: sold 56,000 contracts of the 13Nov 730/715 Put Spread and sold 22,000 contracts of the 27Nov 720/700 Put Spread.
Reallocated premium into year-end topside: bought 28,000 contracts of the SPY 18Dec 775/800 Call Spread.
Single-Stock Convexity (Nvidia): Two-way option volume surged in
NVDAdespite spot softness, highlighted by an institutional restructuring that rolled 52,500 contracts of the 19Feb 210/255 Call Spread down to the 195/245 strike corridor.Desk Tactical Recommendation: Overweight Russell 2000 (
IWM) topside into month-end. Driven by deeply washed-out positioning, high short interest, CTA buying models in small-caps, and historically cheap volatility:Recommended Expression: Outright IWM 27Nov 290 Calls.
Disclaimer: The material provided is for information purposes only and should not be considered as investment advice. The views, information, or opinions expressed in the text belong solely to the author, and not to the author’s employer, organization, committee or other group or individual or company.
Past performance is not indicative of future results.
High Risk Warning: CFDs are complex instruments and come with a high risk of losing money rapidly due to leverage. 68% and 74% of retail investor accounts lose money when trading CFDs with Tickmill UK Ltd and Tickmill Europe Ltd respectively. You should consider whether you understand how CFDs work and whether you can afford to take the high risk of losing your money.
Futures and Options: Trading futures and options on margin carries a high degree of risk and may result in losses exceeding your initial investment. These products are not suitable for all investors. Ensure you fully understand the risks and take appropriate care to manage your risk.
Patrick has been involved in the financial markets for well over a decade as a self-educated professional trader and money manager. Flitting between the roles of market commentator, analyst and mentor, Patrick has improved the technical skills and psychological stance of literally hundreds of traders – coaching them to become savvy market operators!